Choose the Right Performance Test: Smoke to Soak
Each performance test type answers one release question and is blind to the rest. This guide runs one k6 v2.3.0 script against a local order API, selecting smoke, average-load, spike-with-recovery, soak and breakpoint scenarios with the new --scenario flag. The runs show a smoke threshold catching a form-encoded body that a bare script reported as exit 0, a spike that passed its threshold yet left latency twice the baseline, a soak whose 75 ms summary hid a 9.5 ms-per-minute climb, and a breakpoint knee eleven seconds before the first error. It ends with a one-page charter tying each run to a release decision.
A release ticket says "load tested, passed". The run behind it ramped to 500 virtual users for ten minutes and finished green. Three days after launch, order latency has crept up enough that support is fielding complaints. A week later a marketing email lands, the order endpoint returns 503s for a minute, and nobody can say whether the service recovered on its own or was restarted. The test answered none of those questions, because it was never asked one. It produced traffic, and traffic is not a finding.
Grafana's k6 documentation names six test types and is candid that the names are not standardised: it calls the expected-traffic run an "average-load test" precisely because "load test" is used for every kind of traffic simulation. Arguing over the label is not the point. What matters is that each type observes a different failure, and a run designed for one cannot observe the others.
One question per run
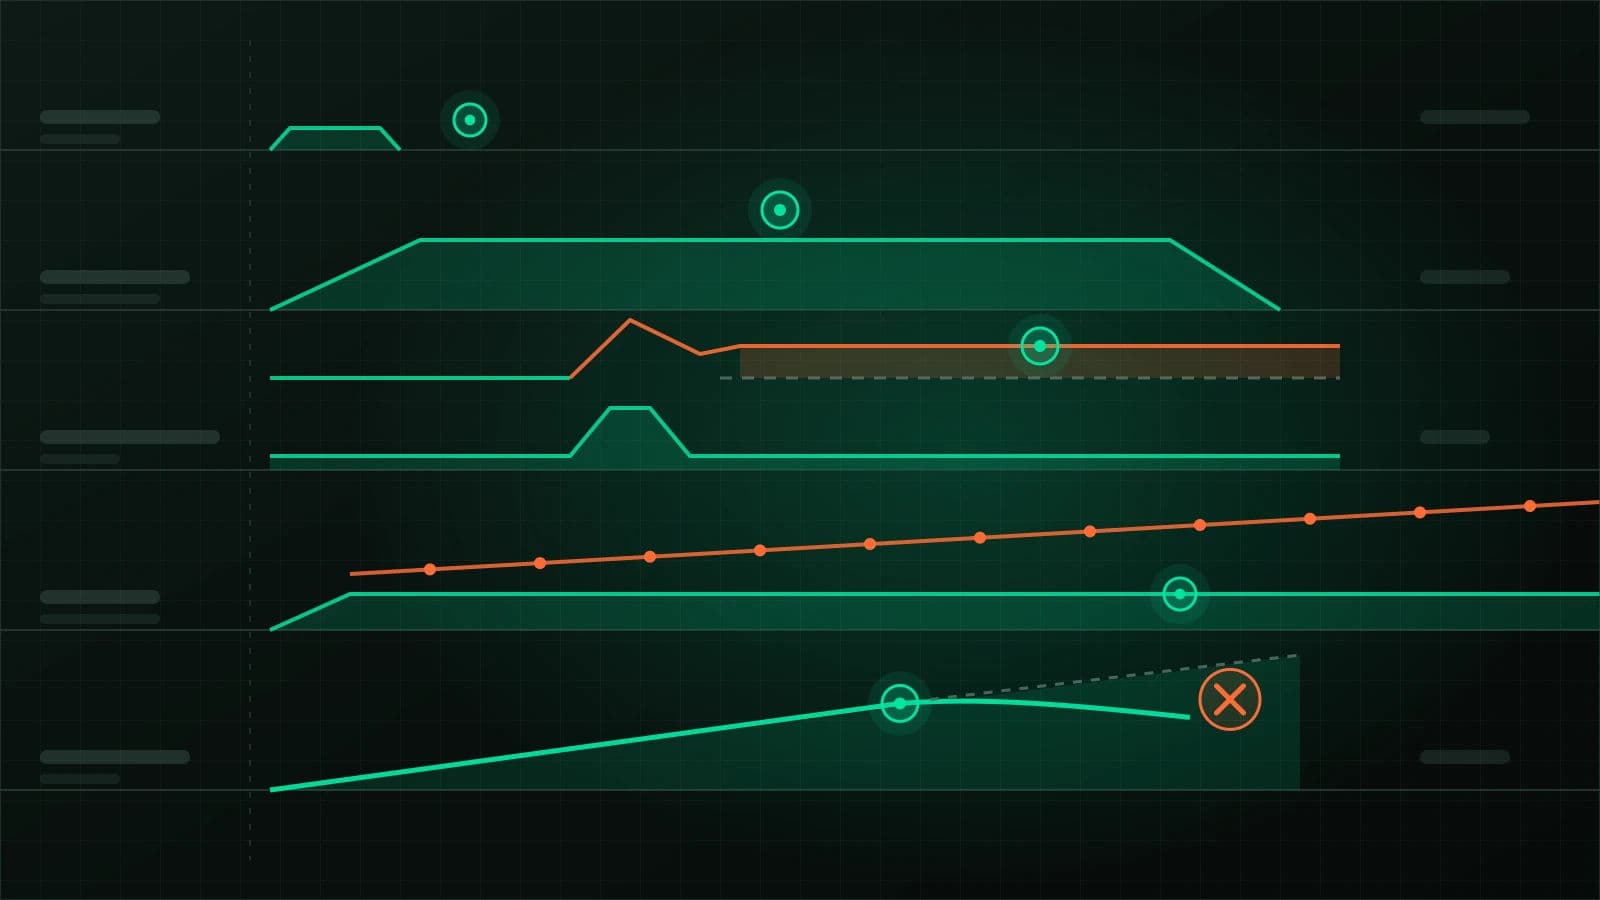
The table below maps each type to the question it answers, the load shape that answers it, and what it is blind to. The durations come from Grafana's own cheat sheet; the last column is the part teams skip.
| Type | Question it answers | Shape and duration | Cannot tell you |
|---|---|---|---|
| Smoke | Does the script work, and does the system answer correctly at trivial load? | 2 to 20 VUs, 30 seconds to 3 minutes | Anything about capacity |
| Average load | Does the expected peak meet the latency and error objectives? | Ramp, hold, ramp down; 5 to 60 minutes | Slow drift, behaviour above peak |
| Stress | How much does performance degrade above the expected peak, and does it survive? | Same shape at a higher, risk-derived level; 5 to 60 minutes | Where the limit is, long-run leaks |
| Spike | Does a sudden rush break the key path, and does the system come back? | Near-vertical ramp, short or no plateau; minutes | Steady-state capacity |
| Soak | Do latency or resources drift over hours at normal load? | Average-load shape with a plateau of hours (Grafana lists 3 to 72) | Peak or burst behaviour |
| Breakpoint | At what load does each failure point appear? | Slow continuous ramp until it breaks; as long as needed | Whether normal traffic is healthy |
Two pieces of Grafana's guidance shape everything that follows. Start with a smoke test and progress to higher loads and longer durations, because running stress, soak or breakpoint first makes it hard to tell a script error or a low-load defect from a capacity limit. And keep shapes simple: ramp up, plateau, ramp down. A "rollercoaster" profile that rises and falls repeatedly wastes resources and makes any problem hard to isolate.
127.0.0.1. The --scenario flag used throughout does not exist before v2.3.0.The order API used in every run
The worked example is a single endpoint, POST /orders, served by a local stub so that every number below is reproducible. The stub has three properties deliberately built in, each standing for a real-world failure: four request slots of 20 ms each, so throughput has a hard ceiling; a queue capped at 200 waiting requests, beyond which it sheds load with 503; and a duplicate-order check that scans every stored order, adding 4 microseconds per order to each later request. That last one is the kind of unindexed lookup that never shows in a ten-minute run. It accepts only application/json and answers anything else with 415.
Production analytics say the busiest hour peaks at 40 orders per second. That number is the input every other test is sized from, and it has to come from first-party data. An AI assistant can usefully turn a traffic export into candidate stage definitions, but it cannot know your peak; if it proposes a number, trace it back to your analytics before using it. Turning sessions into an arrival rate is covered in the guide to building a k6 load model from traffic assumptions, and the k6 Script Generator gives a reviewable starting script.
One script, a named scenario per gate
k6 v2.3.0 added k6 run --scenario <name>, which runs selected scenarios from a script without editing it. That makes it practical to keep every gate for an endpoint in one file, so the smoke test always exercises exactly the request logic the soak test will. Each threshold is keyed to a scenario tag, which k6 applies to every sample a scenario emits.
import http from 'k6/http';
import { check } from 'k6';
import exec from 'k6/execution';

const BASE = __ENV.BASE_URL || 'http://127.0.0.1:3333';
const PEAK = 40; // orders per second at the busiest production hour

export const options = {
  scenarios: {
    smoke: {
      executor: 'shared-iterations',
      vus: 2,
      iterations: 20,
      maxDuration: '1m',
    },
    load: {
      executor: 'ramping-arrival-rate',
      timeUnit: '1s',
      preAllocatedVUs: 20,
      maxVUs: 200,
      stages: [
        { target: PEAK, duration: '30s' },
        { target: PEAK, duration: '2m30s' },
        { target: 0, duration: '15s' },
      ],
    },
    spike_baseline: {
      executor: 'constant-arrival-rate',
      rate: PEAK,
      timeUnit: '1s',
      duration: '30s',
      preAllocatedVUs: 20,
    },
    spike: {
      executor: 'ramping-arrival-rate',
      startTime: '30s',
      timeUnit: '1s',
      startRate: PEAK,
      preAllocatedVUs: 100,
      maxVUs: 600,
      stages: [
        { target: PEAK * 5, duration: '5s' },
        { target: PEAK * 5, duration: '15s' },
        { target: PEAK, duration: '5s' },
      ],
    },
    spike_recovery: {
      executor: 'constant-arrival-rate',
      startTime: '55s',
      rate: PEAK,
      timeUnit: '1s',
      duration: '1m',
      preAllocatedVUs: 20,
      maxVUs: 200,
    },
    soak: {
      executor: 'constant-arrival-rate',
      rate: PEAK,
      timeUnit: '1s',
      duration: '6m',
      preAllocatedVUs: 20,
      maxVUs: 200,
    },
    breakpoint: {
      executor: 'ramping-arrival-rate',
      timeUnit: '1s',
      preAllocatedVUs: 50,
      maxVUs: 1000,
      stages: [{ target: 600, duration: '3m' }],
    },
  },
  thresholds: {
    'checks{scenario:smoke}': ['rate==1'],
    'http_req_failed{scenario:smoke}': ['rate==0'],
    'http_req_duration{scenario:load}': ['p(95)<150'],
    'http_req_failed{scenario:load}': ['rate<0.01'],
    'http_req_duration{scenario:spike_recovery}': ['p(95)<150'],
    'http_req_failed{scenario:spike_recovery}': ['rate<0.01'],
    'http_req_duration{scenario:soak}': ['p(95)<150'],
    'http_req_failed{scenario:breakpoint}': [
      { threshold: 'rate<0.05', abortOnFail: true, delayAbortEval: '10s' },
    ],
  },
};

export default function () {
  const order = { sku: `SKU-${exec.scenario.iterationInTest % 500}`, qty: 1 };
  const res = http.post(`${BASE}/orders`, JSON.stringify(order), {
    headers: { 'Content-Type': 'application/json' },
  });
  check(res, { 'order created': (r) => r.status === 201 });
}
The durations are compressed so each run finishes in minutes on a laptop. A real average-load gate would hold its plateau for tens of minutes and a real soak for hours; the shapes are what carry over. Arrival-rate executors keep starting iterations at the configured rate when responses slow down, which matters when the slowdown is what you are measuring.
When you select one scenario, k6 tells you which thresholds it dropped. This is the first line of k6 run --scenario smoke orders.js, wrapped here for width:
level=warning msg="--scenario skipped thresholds for excluded scenarios:
  http_req_duration{scenario:load}; http_req_duration{scenario:soak};
  http_req_duration{scenario:spike_recovery}; http_req_failed{scenario:breakpoint};
  http_req_failed{scenario:load}; http_req_failed{scenario:spike_recovery};
  these thresholds remain skipped even if another scenario emits matching tags"
If a threshold you expected to gate the release is in that list, the run cannot fail on it.
Smoke: prove the script before the system
An earlier draft of the request sent the order as a plain object:
// Wrong: k6 form-encodes object bodies
const res = http.post(`${BASE}/orders`, order);

// Right: send JSON and say so
const res = http.post(`${BASE}/orders`, JSON.stringify(order), {
  headers: { 'Content-Type': 'application/json' },
});
The k6 HTTP reference states that object bodies are sent as application/x-www-form-urlencoded. The stub answers 415 to every one of them. Run as a bare script with vus: 2, iterations: 20 and no thresholds, the wrong version reported 100% failed requests and 0 of 20 checks passing, and k6 exited with status 0. A check records a result; it does not fail the run. Under the scenario thresholds above, the same mistake fails loudly:
  █ THRESHOLDS

    checks{scenario:smoke}
    ✗ 'rate==1' rate=0.00%

    http_req_failed{scenario:smoke}
    ✗ 'rate==0' rate=100.00%

level=error msg="thresholds on metrics 'checks{scenario:smoke}, http_req_failed{scenario:smoke}' have been crossed"
exit=99
With the body fixed, the smoke run passed with a p95 of 22.88 ms across 20 requests. That figure is the unloaded baseline for this endpoint. Grafana's guidance is to rerun the smoke test whenever the script or the relevant application code changes, and never to run another type with an untested script. If a 415 or 422 shows up, the HTTP status code reference helps separate "the request is wrong" from "the server is overloaded" before anyone starts tuning.
Average load: the objective at expected peak
The load scenario ramps to 40 orders per second over 30 seconds, holds for two and a half minutes, and ramps down. It passed: p95 47.31 ms against the 150 ms objective, zero failures over 6,900 requests.
A pass is not the whole reading. The minimum was 20.2 ms and the maximum 50.09 ms, in a run that never came near the four-slot ceiling, so the rise came from something other than load. An average-load test is too short to say whether that trend continues, and its threshold had no reason to fail. Carry it into the soak charter. Grafana's guidance on proportions also applies: a ramp-up of roughly 5 to 15% of total duration, and a plateau at least five times longer than the ramp.
Stress: the same script at a level a real event justifies
A stress test reuses the average-load scenario at a higher target with a longer ramp. Grafana is explicit that there is no fixed percentage; the number comes from the event you are preparing for, such as a payroll date or a campaign forecast, and the charter should name it. It runs only after average load has passed, or a defect that appears at 40 orders per second gets misread as a limit at 120. Worse performance is expected. The question is how much worse, and whether the error rate stays tolerable for the length of the event.
Spike: survival is half the answer
Grafana's spike guidance lists recovery time and time to return to normal among the metrics to assess, and warns that the run often does not finish. A spike scenario on its own measures only the rush. To answer the recovery question, the script surrounds the spike with two scenarios at normal load: spike_baseline for 30 seconds before, and spike_recovery for a minute after, sequenced with startTime. The command selects all three:
k6 run --summary-mode full --scenario spike_baseline,spike,spike_recovery orders.jsFull summary mode adds a block per scenario. Trimmed to the lines that matter:
  █ SCENARIO: spike
    http_req_duration..........: avg=925.58ms min=139µs   med=1.12s   max=1.87s  p(90)=1.78s   p(95)=1.82s
    http_req_failed............: 22.27% 912 out of 4094
    dropped_iterations.........: 105    0.912635/s
  █ SCENARIO: spike_baseline
    http_req_duration..........: avg=23.5ms  min=20.09ms med=23.62ms max=29.78ms p(90)=25.2ms  p(95)=25.45ms
    http_req_failed............: 0.00%  0 out of 1200
  █ SCENARIO: spike_recovery
    http_req_duration..........: avg=56.45ms min=37.6ms  med=43.53ms max=1.21s  p(90)=47.37ms p(95)=47.97ms
    http_req_failed............: 0.00%  0 out of 2386
    dropped_iterations.........: 15     0.130376/s
The spike itself behaved as designed: the queue filled, 22% of orders were shed with 503, and the rest waited up to 1.87 seconds. The recovery threshold, p95 below 150 ms, passed. It also missed the finding. Recovery p95 was 47.97 ms against a baseline of 25.45 ms. The system did not return to normal; it settled at nearly twice its pre-spike latency and stayed there, because the roughly 3,200 orders written during the rush made every later duplicate check slower. The 1.21-second maximum and the 15 dropped iterations in the recovery window come from the spike's backlog: spike_recovery starts the moment the spike's last stage ends, while requests are still queued.
A threshold expression compares one aggregation with a fixed value, so "within 30% of baseline" has to be written as a number taken from the baseline window of an earlier run. Here that would be p(95)<33, and this run would have failed it. The spike gate asks whether the service comes back, so its threshold has to measure that. If clients retry 503s automatically, the recovery window also has to include their retries; the article on testing idempotency, retries and timeouts covers what that does to duplicate orders.
Soak: the end-of-test summary hides the drift
The soak scenario holds 40 orders per second for six minutes, a stand-in for the hours a real soak needs. Its threshold passed comfortably:
    http_req_duration{scenario:soak}
    ✓ 'p(95)<150' p(95)=75.24ms
The aggregate is the wrong instrument for a soak. A whole-run percentile blends the healthy first minutes with the degraded last ones, so a steady climb reads as a moderate average. Writing samples out with --out csv=soak.csv and grouping them by minute shows what actually happened:
// p95-by-minute.mjs: node p95-by-minute.mjs soak.csv
import { readFileSync } from 'node:fs';

const [header, ...rows] = readFileSync(process.argv[2], 'utf8').trim().split('\n');
const col = Object.fromEntries(header.split(',').map((name, i) => [name, i]));

const windows = new Map();
let start;
for (const row of rows) {
  const f = row.split(',');
  if (f[col.metric_name] !== 'http_req_duration') continue;
  const t = Number(f[col.timestamp]);
  start ??= t;
  const minute = Math.floor((t - start) / 60);
  if (!windows.has(minute)) windows.set(minute, []);
  windows.get(minute).push(Number(f[col.metric_value]));
}

for (const [minute, values] of windows) {
  values.sort((a, b) => a - b);
  const p95 = values[Math.ceil(values.length * 0.95) - 1];
  console.log(`minute ${minute}: n=${values.length} p95=${p95.toFixed(1)}ms`);
}
minute 0: n=2385 p95=29.8ms
minute 1: n=2400 p95=40.0ms
minute 2: n=2399 p95=49.3ms
minute 3: n=2400 p95=58.8ms
minute 4: n=2400 p95=68.7ms
minute 5: n=2399 p95=77.4ms
minute 6: n=17 p95=79.1msThe last line is the few requests that completed after the six-minute mark. The rest is a straight line: about 9.5 ms added every minute. If that slope held, p95 would cross 150 ms around minute 13, and an eight-hour soak would be far past any objective, yet the six-minute summary showed 75 ms and a tick. The soak verdict is the slope, judged per window, alongside backend memory, CPU, queue depth and storage over the same period. Grafana's soak guidance calls backend monitoring especially important for this type. In k6's CSV output the timestamp column is in whole seconds, which is fine for minute windows; for finer resolution, send results to a time-series backend instead. The API Response Time Analyzer is useful for inspecting one window's distribution, and reading p95 from a HAR without guessing explains why a percentile from a small window needs care.
Breakpoint: the limit appears before the errors do
The breakpoint example in Grafana's breakpoint guide, as published on 2026-10-14, puts executor: 'ramping-arrival-rate' directly in options next to stages. That is not a valid top-level option. Running that shape with k6 v2.3.0 prints a warning and quietly builds a different test:
level=warning msg="There were unknown fields in the options exported in the script" error="json: unknown field \"executor\""
     scenarios: (100.00%) 1 scenario, 20 max VUs, 34s max duration (incl. graceful stop):
              * default: Up to 20 looping VUs for 4s over 1 stages (gracefulRampDown: 30s, gracefulStop: 30s)
The top-level stages shortcut produced a ramping-VUs test, a closed model whose request rate falls as the system slows. That is the opposite of what a breakpoint test needs. The executor belongs inside a named scenario, as in the breakpoint block of the script above.
That scenario ramps from zero to 600 orders per second over three minutes and aborts once more than 5% of requests fail. It aborted at 56 seconds with exit code 99 and a failure rate of 7.11% (346 of 4,866). The abort point is not the limit. Grouping the CSV output by the second each request completed:
second 38: 130 requests,  0 failed, avg   31 ms   (target ~127/s)
second 39: 131 requests,  0 failed, avg   37 ms   (target ~130/s)
second 45: 118 requests,  0 failed, avg  621 ms   (target ~150/s)
second 49: 112 requests,  0 failed, avg 1259 ms   (target ~163/s)
second 50: 142 requests, 30 failed, avg 1141 ms
second 54: 183 requests, 76 failed
Throughput stopped following the target at about 130 orders per second, eleven seconds before the first 503. Between those points average latency went from 37 ms to 1.26 seconds with no failures at all, as the queue filled; only when it overflowed did errors begin. The failure rate threshold is cumulative over the run, so it tripped six seconds later still. Grafana's guide lists five failure points worth identifying separately: degraded performance, severely degraded performance, timeouts, errors, and collapse. An error-rate abort only finds the fourth. Record the knee as the capacity figure, and use the abort only to stop the run safely.
Two conditions before running one: every other type should already pass, and elasticity should be off. Grafana warns that in an autoscaling environment the test may find "only the limit of your cloud account bill".
Three mistakes that look like results
Stress before smoke. The symptom is a failed high-load run whose errors are 4xx rather than 5xx or timeouts, or whose failure rate is the same at the first stage as at the last. The cause is a script or data defect that was always there. Check the failure rate in the first minute: if it is already non-zero at low load, the run measured the script.
A user count called realistic. The symptom is a test with vus or VU stages, whose request rate in the summary is lower than the plan assumed and drops further as latency rises. The cause is a closed model, where each VU waits for its response before starting again. Compare http_reqs per second with the arrival rate your analytics justify; if nobody can produce that rate, the test has no realism to claim.
No recovery window. The symptom is a spike or stress report that describes the peak and ends there. The cause is a script whose last scenario is the rush itself. Add a baseline-rate scenario after it, give it a threshold derived from the pre-spike baseline, and watch the backend for the same window. The spike run above passed every absolute threshold and still left the service twice as slow.
A one-page charter per run
Write the release decision down before the run, so the result cannot be reinterpreted afterwards. A charter for the spike gate on the order API:
decision: ship the order service before the 2026-11 campaign email, or hold
risk: a campaign email produces a 5x burst on POST /orders within seconds
type: spike, with baseline and recovery windows
workload:
  baseline: 40 orders/s (peak hour, first-party analytics, last 30 days)
  spike: ramp to 200 orders/s in 5s, hold 15s, back to 40 in 5s
  source of 5x: open rate x click-through from the previous two campaigns
environment: staging, same instance count as production, autoscaling off
data: unique SKUs per iteration; order table seeded to production row count
pass:
  baseline: p95 < 150 ms, failures < 1%
  spike: key path survives; shed requests answered with 503, not timeouts
  recovery: p95 within 30% of baseline within 60s, failures < 1%
stop: abort if failures exceed 50% for 10s or staging alerts page anyone
observe: queue depth, DB connections, pod restarts across all three windows
owner: the engineer who will make the ship or hold call
The data line matters more than it looks. The stub's degradation depends on how many orders exist, so a test against an empty table would have hidden it entirely. If you need bounded, non-repeating request data, the Test Data Generator can produce it. Later parts of this series build on this charter: turning its pass criteria into thresholds that fail CI for the right reasons, checking that the load generator was not the bottleneck, modelling mixed workloads with scenarios, and connecting each run to traces.
Apply this today
Pick the performance test your team already runs and write its charter. If the decision line is hard to fill in, the test is not gating anything yet. Then do three things in order. Add a smoke scenario with checks and http_req_failed thresholds, and confirm it fails with a non-zero exit code when you break the request on purpose. Replace any VU-count plateau with an arrival rate traced to analytics. Add a recovery scenario after whatever peak you test, with a threshold taken from the baseline. Keep the run's exit code, the full per-scenario summary, the per-minute p95 table, and the charter together as the evidence for the release call.
Questions about choosing a performance test
Do all six types need to run on every release?
No. Smoke runs whenever the script or the relevant code changes, and it is cheap enough for every pull request. Average load suits a regular cadence or significant changes. Spike and stress are tied to known events. Soak and breakpoint are expensive and run after changes that could affect long-run resource use or capacity. Grafana's guidance is that the emphasis follows your risk profile: systems at risk from long use should prioritise soak, systems at risk from intense use should prioritise stress.
What separates a stress test from a breakpoint test?
A stress test holds a specific above-peak level that a real event justifies and asks whether the system copes. A breakpoint test has no target level; it keeps ramping until something fails and asks where that is. A stress test is expected to finish. A breakpoint test is expected not to.
Can these tests run against production?
Grafana describes one production use for the lightest type: a smoke test with simple logic can act as a synthetic monitor of availability and performance. The heavier types change the system you are measuring and can affect real users, so they need an isolated environment sized like production, or a deliberate, agreed exception with a stop condition.
Is a one-hour soak worth anything?
It can catch a fast leak, and the per-window method above works at any length. It cannot catch anything slower than its own duration, such as log rotation, connection recycling, scheduled jobs or storage that fills over a day. Size the soak from the slowest cycle you are worried about, and say in the charter which cycles it covers.
Primary references
- Grafana k6 docs, Load test types. The six types, the cheat sheet of load and duration per type, starting with smoke, the lack of naming consensus, and the advice to avoid rollercoaster load patterns.
- Grafana k6 docs, Smoke testing. 2 to 20 VUs for 30 seconds to 3 minutes, rerunning on every script change, and smoke as a synthetic production monitor.
- Grafana k6 docs, Average-load testing. Why Grafana avoids the bare term "load test", ramp-up at 5 to 15% of duration, and a plateau at least five times the ramp.
- Grafana k6 docs, Stress testing. No fixed percentage above average, and running stress only after average-load tests.
- Grafana k6 docs, Spike testing. Short or absent plateau, errors and unfinished runs as normal, and recovery time as a metric to assess.
- Grafana k6 docs, Breakpoint testing. The five failure points, avoiding elastic environments, and stopping with
abortOnFail; also the published example with a top-levelexecutor. - Grafana k6 docs, Soak testing. Typical durations from 3 to 72 hours, the defects soak tests find, and the emphasis on backend monitoring.
- Grafana k6 docs, Scenarios. Scenario options including
startTime, scenario tags, and running selected scenarios with--scenario. - Grafana k6 docs, Thresholds. Thresholds on tagged sub-metrics,
abortOnFailanddelayAbortEval, checks not affecting the exit status, and skipped thresholds under--scenario. - Grafana k6 docs, Open and closed models. Why a closed model's arrival rate falls as response times rise.
- Grafana k6 docs, http.post(). Object bodies sent as
application/x-www-form-urlencoded. - Grafana k6 docs, End-of-test summary. The
fullsummary mode with per-scenario results. - Grafana k6 docs, CSV output. The
--out csvoption and the column layout used for per-minute grouping. - grafana/k6 v2.3.0 release notes. The
--scenarioflag, its restrictions, and the threshold-skipping behaviour for excluded scenarios.